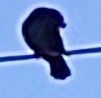
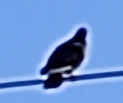
Athens, Greece. City of the Parthenon and other world-class ancient ruins, a lively night life and, saddly, overhead power cables everywhere. Pigeons love power cables.
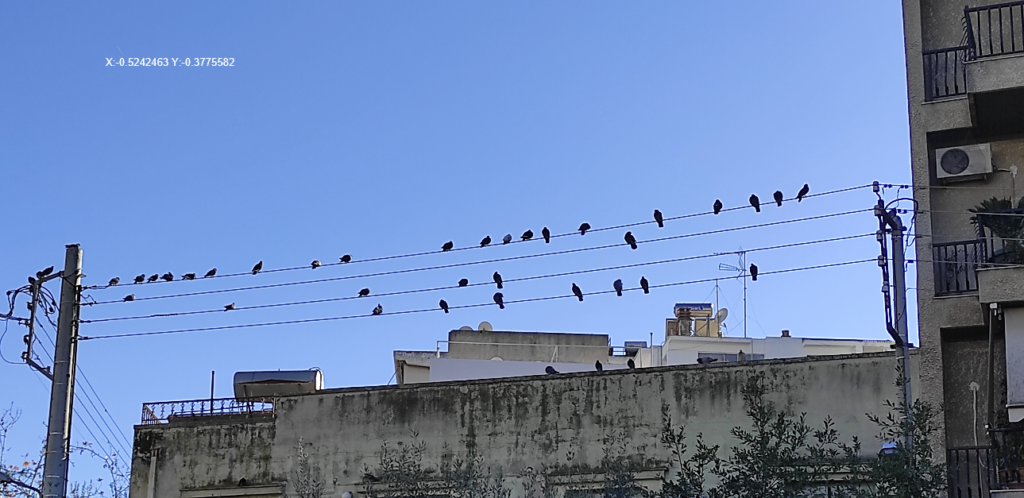
As is always the case with real estate, location is everything. Pigeons like some wires better than others, what with the better view and everything. As a result, some stretches are densely populated during the day. Pro tip: do not attempt to cross underneath (ask me how I know that).
It must be a common idea that pigeons on wires resemble notes on a five-line staff (US) or stave (UK), although urban power cables usually come in groups of four – three phases and neutral, instead of five which is needed for a regular staff, but I though why not try it out.
There are basically two ways to go about it:
a. Grab your guitar / flute / synth / whatever, walk to your local pigeon-music score, play what you see, or
b. Take photos, have your computer do the rest
So, assuming, dear reader, that you would, as would I, choose ‘b’, let’s spell out the steps:
Prepare training data
-> Train computer vision model to identify pigeon positions
-> Use model to translate a few photos to pigeon positions
-> Experiment with translating pigeon positions / shape (other features) to sound
So, this post is about how we prepare the training data for OpenCV.
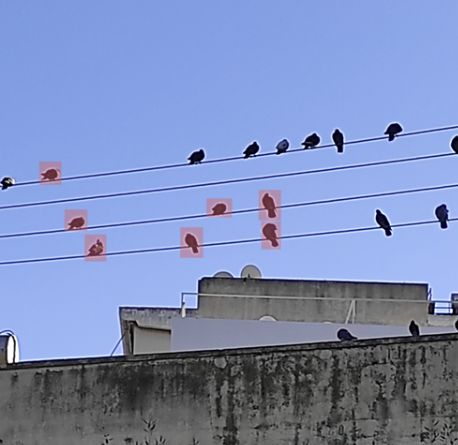
A quick search indicates that for the training we’ll need a few photos with no pigeons (negative samples) and a few photos with pigeons (positive samples), the positions of which manually identified. Assuming the photos are called img1.jpg, img2.jpg and so on, for the positive samples we need to create a file called info.dat, containing information similar to the following:
img/img1.jpg 1 130 105 40 75
img/img2.jpg 2 90 120 40 35 60 35 15 15
Each line consists of the path and file name, the number of identified instances (pigeons) and the coordinates of the bounding box surrounding each instance (that is 4 numbers per instance).
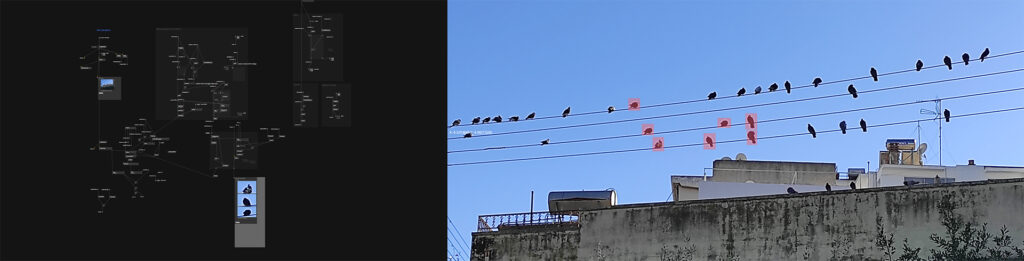
There’s just no way we’re doing this by hand, so let’s fire up vvvv(gamma) / VL this time, instead of the good old vvvv(beta), and make a tool that allows us to draw a rectangle around each pigeon and outputs the training data file.
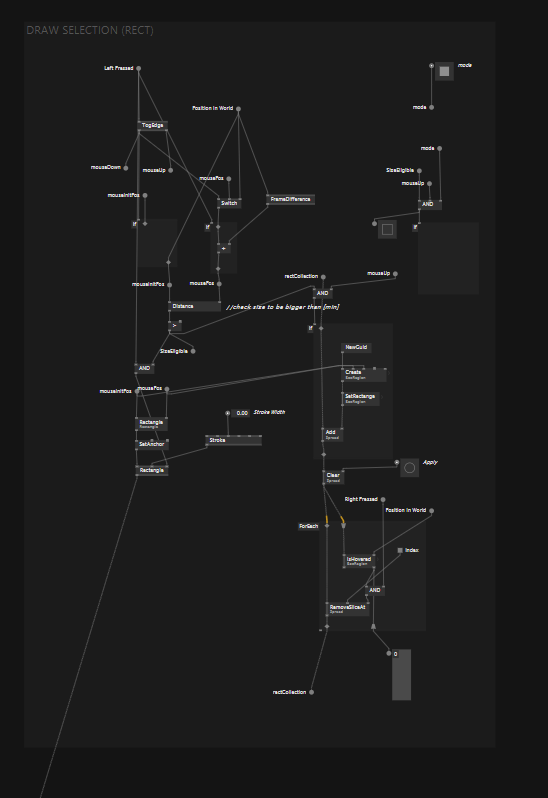
The procedure is split in two stages: image segmentation (using the mouse to draw a rectangle over each pigeon on the photo) and exporting of the collected data.
The tool also allows editing, redrawing, moving and deleting a rectangle.
As an aside the tool exports the photos in order to see and check the output area.


It goes without saying that this tool can be used in any similar application, not only for pigeons.
In a future post, we may go through the training of the model and/or the translation of the positions of the pigeons to music.